Tables
The schema includes developers, repositories, repository metrics, languages, and companies.
Data Model
The project uses five normalized tables to separate owners, repositories, metrics, languages, and companies. This structure makes downstream ranking, lifecycle, and cross-entity reporting easier to query.
Schema
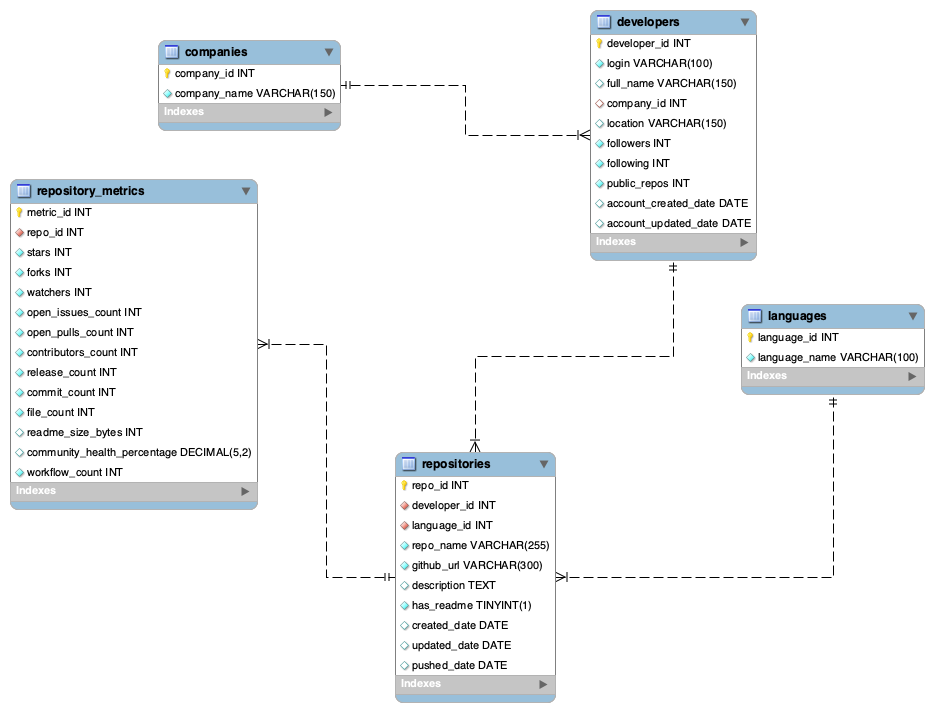
The schema includes developers, repositories, repository metrics, languages, and companies.
The relational design separates profile information, repository metadata, and performance metrics so that queries can isolate ownership, repository activity, and language signals more clearly.
The repository metadata file has much wider coverage than the separate GitHub users file. That mismatch is why the live analysis relies on the full repository source.
Methodology
Query 1 uses DENSE_RANK() over stars and forks to rank repositories by visibility across owners and languages.
Query 2 uses DATEDIFF() to measure the number of days between repository creation and last push.
Query 3 uses CASE WHEN logic to classify repositories into impact tiers using star thresholds.
Query 4 uses COUNT, SUM, and AVG with GROUP BY to compare owners by total repositories, stars, forks, and average commits.
Query 5 uses two CTEs and a CROSS JOIN to identify developers whose repository counts exceed the sample mean.
Queries 6 and 7 use a five-table join and a reusable view to precompute active_days and impact_level for downstream reporting.
SQL Snippets
SELECT
    r.repo_name,
    d.login AS owner_login,
    l.language_name,
    m.stars,
    m.forks,
    DENSE_RANK() OVER (ORDER BY m.stars DESC, m.forks DESC) AS popularity_rank
FROM repositories r
JOIN developers d ON r.developer_id = d.developer_id
JOIN languages l ON r.language_id = l.language_id
JOIN repository_metrics m ON r.repo_id = m.repo_id
ORDER BY popularity_rank, r.repo_name;SELECT
r.repo_name,
d.login AS owner_login,
r.created_date,
r.pushed_date,
DATEDIFF(r.pushed_date, r.created_date) AS active_days
FROM repositories r
JOIN developers d ON r.developer_id = d.developer_id
WHERE r.created_date IS NOT NULL
AND r.pushed_date IS NOT NULL
ORDER BY active_days DESC;SELECT
r.repo_name,
d.login AS owner_login,
m.stars,
m.forks,
CASE
WHEN m.stars >= 10 THEN 'High Popularity'
WHEN m.stars >= 3 THEN 'Medium Popularity'
WHEN m.stars >= 1 THEN 'Low Popularity'
ELSE 'No Stars Yet'
END AS popularity_category
FROM repositories r
JOIN developers d ON r.developer_id = d.developer_id
JOIN repository_metrics m ON r.repo_id = m.repo_id
ORDER BY m.stars DESC, m.forks DESC;SELECT
d.login AS owner_login,
COUNT(r.repo_id) AS total_repositories,
SUM(m.stars) AS total_stars,
SUM(m.forks) AS total_forks,
ROUND(AVG(m.commit_count), 2) AS avg_commits
FROM developers d
JOIN repositories r ON d.developer_id = r.developer_id
JOIN repository_metrics m ON r.repo_id = m.repo_id
GROUP BY d.developer_id, d.login
ORDER BY total_stars DESC, total_repositories DESC;WITH developer_repo_counts AS (
SELECT
d.developer_id,
d.login,
COUNT(r.repo_id) AS repo_count
FROM developers d
LEFT JOIN repositories r ON d.developer_id = r.developer_id
GROUP BY d.developer_id, d.login
),
average_repo_count AS (
SELECT AVG(repo_count) AS avg_repo_count
FROM developer_repo_counts
)
SELECT
drc.login,
drc.repo_count,
ROUND(arc.avg_repo_count, 2) AS sample_average_repo_count
FROM developer_repo_counts drc
CROSS JOIN average_repo_count arc
WHERE drc.repo_count > arc.avg_repo_count
ORDER BY drc.repo_count DESC;CREATE OR REPLACE VIEW repository_analysis_view AS
SELECT
d.login AS owner_login,
d.full_name,
c.company_name,
d.location,
d.followers,
d.public_repos,
r.repo_name,
r.github_url,
l.language_name,
r.has_readme,
r.created_date,
r.updated_date,
r.pushed_date,
DATEDIFF(r.pushed_date, r.created_date) AS active_days,
m.stars,
m.forks,
m.watchers,
m.open_issues_count,
m.contributors_count,
m.release_count,
m.commit_count,
m.file_count,
m.community_health_percentage,
CASE
WHEN m.stars >= 10 THEN 'High Impact'
WHEN m.stars >= 3 THEN 'Medium Impact'
WHEN m.stars >= 1 THEN 'Low Impact'
ELSE 'Early Stage'
END AS impact_level
FROM developers d
LEFT JOIN companies c ON d.company_id = c.company_id
JOIN repositories r ON d.developer_id = r.developer_id
JOIN languages l ON r.language_id = l.language_id
JOIN repository_metrics m ON r.repo_id = m.repo_id;Data Sources
Repository name, owner, URL, stars, forks, watchers, commit count, contributors, primary language, files, README size, health score, and dates.
Login, name, company, location, followers, following, public repo count, account creation date, and profile-level context fields.
The natural join key, owner login, is sparse across the two sources, so the presentation sample and the live analytics layer use different coverage strategies.